
.jpg)
OK. What does NOIR stands for? Nominal, Ordinal, Interval, Ratio
1: Nominal
Nominal is the lowest level of data. It can only classify data into groups, and there is no difference between these categories. Some examples are:
Gender

Race


As we can see in these examples, there is no way to decide which of these attributes are better than the other. As a researcher, try to collect these types of data only when necessary because you can only calculate COUNTS and MODE only.
2: ORDINAL
Ordinal is the 2nd tier. Better than Nominal but not the best. Ordinal data is still categorical, but you can know which is better. An example is:
LEAGUE TABLES:


We can see that Arsenal is 1 point more than Man City, the PTS is at Interval scale. (More on this later)
Other Examples are:
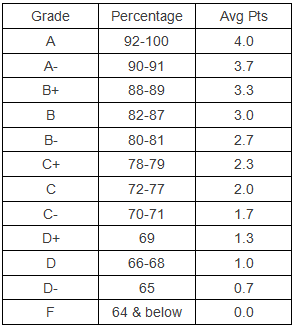
Grades:
.jpg)
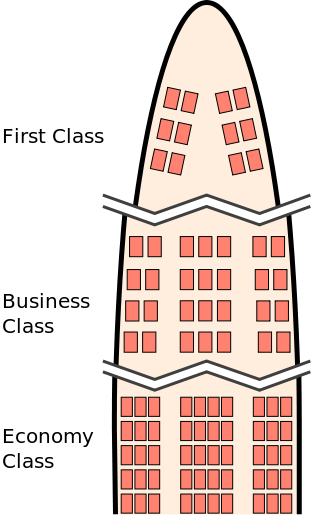
Travel Class:
Thats enough for ordinal :)
3: Interval
Interval is the 2nd best level of measurement. We can tell which is better and by how much. however the limitations is that you cannot perform mathematical calculations with it. Examples are:
Scores:

We can see the Vikings are at 14 and the wildcats are at 7. However we cannot say that Vikings are 2 times better than Wildcats. The score is just an indication who is better.
CGPA:
Likert Scale:

Eventhough some say the likert scale is Ratio, i would strongly stand to say that it is interval. however there are exceptions, like if you take the average of multiple likert scales, it can be a ratio.
4: Ratio
Ratio is the best type of data, you can do lots of things with this type. You have high flexibility and you are able to transform it into the other 3 levels (Yes, you can downgrade it) Examples are:
Height:

Height, in numerical value such as centimeters or millimeters, can be manipulated mathematically. An individual with the height of 2meters is 2 times higher than 1 meters.
Speed:
.jpg)
Salary:
.jpg)
For these 2 examples, im sure you understand why they are ratio level :)
Thanks! thats it for today! if you need us to help you analyse, drop us a message!
No comments:
Post a Comment